Chart Patterns AI – Identify 16 Essential Chart Patterns Instantly
What is ChartPatterns.ai?
ChartPatterns.ai is an AI-powered tool that visually detects 16 essential chart patterns on financial graphs. It works with all types of trading charts, including Stocks, Forex, and Crypto. You can analyze up to 3 images or 1 video at once. Simply upload your chart, and let AI identify key patterns instantly.
Recognized Chart Patterns
ChartPatterns.ai identifies 16 globally recognized chart patterns, including: Ascending Triangle, Descending Triangle, Symmetrical Triangle, Bullish Flag, Bearish Flag, Bullish Pennant, Bearish Pennant, Rectangular Formation, Cup and Handle, Inverted Cup and Handle, Double Top, Double Bottom, Head and Shoulders, Inverse Head and Shoulders, Rising Wedge, Falling Wedge.
Key Steps Before Detecting Chart Patterns
Make sure you understand these steps before starting chart pattern detection. This way, you can achieve more accurate and effective results.
1. Causes of False Signals
AI analyzes charts based on visual elements. Therefore, every line or additional element on the chart can be perceived as part of a pattern, leading to false signals. To receive accurate signals, the following elements must be removed:
- Background Grids: Background grids cause false signals and should be removed.
- Indicator Lines: Indicator lines can be misinterpreted as part of a pattern, leading to false signals.
- Trend Lines: Trend lines mislead AI and result in false signals.
2. Optimize Zoom Level for Accurate Signals
Every chart has unique characteristics, including its shape, flow, and candlestick structure. These factors directly impact the accuracy of chart pattern detection. If the zoom level is too flat, pattern details become hard to recognize, and if the zoom is too tight, larger candles may cause false signals. To achieve the best results, it’s crucial to find the right balance.
An optimal zoom level allows you to see pattern details clearly while avoiding distortions caused by extreme compression or over-zooming. It ensures that the chart patterns are properly aligned, making them easier to detect by both the human eye and AI algorithms.
To help you achieve the perfect zoom level, we recommend a step-by-step approach. Start by testing different zoom levels, observing how patterns change at each level. Pay attention to how flat charts may obscure pattern details, while over-zoomed charts may exaggerate large candles, leading to false detections. The goal is to achieve a zoom where the patterns appear clear, distinct, and proportional.
3. Chart Types and Theme
Candles, Bars, and Line charts can be used for analysis. To ensure clarity, there must be sufficient contrast between the background and chart elements. The theme can be either light or dark, as long as the chart elements are clearly visible and stand out from the background.
Upload Clean Chart Images for Accurate Detection
To ensure accurate pattern detection, it’s important to upload clean and clear chart images. You can:
-
-
Use the TradingView Chart Widget: Use our
TradingView Chart Widget directly on our site, where you can select any stock, forex, or crypto chart, adjust zoom levels, and download it instantly.
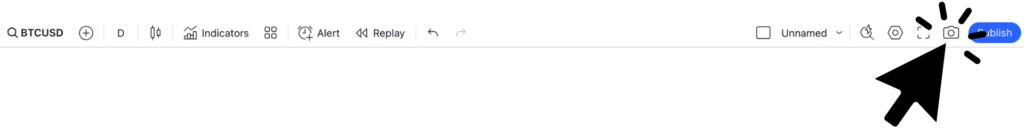
- Download Images from TradingView: Use the “Download Image Button” available on the TradingView platform.
- Take Screenshots from Your Platform: Take screenshots or save images directly from the charting platforms you already use. Make sure to crop out unnecessary elements like side panels, toolbars, and extra labels to avoid false signals.
-
Use the TradingView Chart Widget: Use our
TradingView Chart Widget directly on our site, where you can select any stock, forex, or crypto chart, adjust zoom levels, and download it instantly.
- Take Mobile Screenshots: Capture screenshots on your phone and ensure you crop unnecessary elements like menu bars, buttons, and side panels to avoid false signals.
- Remove Extra Elements: Ensure the image contains only the price movement. Remove grids, indicator lines, and any unnecessary annotations.
By following these steps, you’ll maximize the accuracy of pattern detection and reduce the chance of false signals.